mplutils.lollipop#
- mplutils.lollipop(x, y, ax=None, base=0.0, **kwargs)[source]#
Draw a lollipop chart on the given axes.
- Parameters:
- xarray_like
X positions or categorical labels. Non-numeric values are treated as categories and mapped to integer positions.
- yarray_like
Y values for each lollipop.
- ax
matplotlib.axes.Axes, optional. Target axes to plot on.
If None, use last active axes.
- base
floator array_like, optional Baseline value(s) from which the vertical lines start. Default is 0.
- **kwargs
Additional keyword arguments passed to
Axes.plotfor marker styling. Common aliases likems,lw,ls, andcare supported.
- Returns:
- markers
matplotlib.lines.Line2D The Line2D object corresponding to the lollipop markers.
- lines
matplotlib.collections.LineCollection The LineCollection corresponding to the lollipop sticks.
- markers
Examples
import matplotlib.pyplot as plt

import mplutils as mplu

fig, (ax0, ax1) = plt.subplots(1, 2, layout=mplu.FixedLayoutEngine())

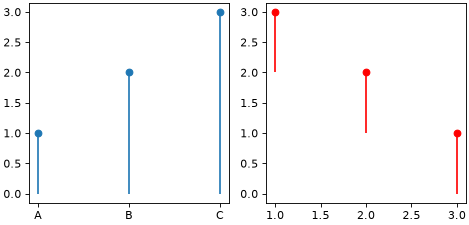
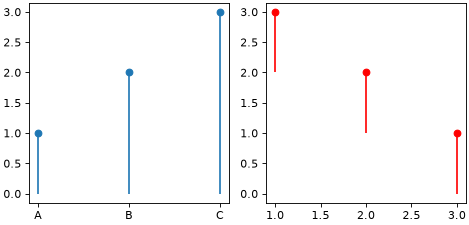
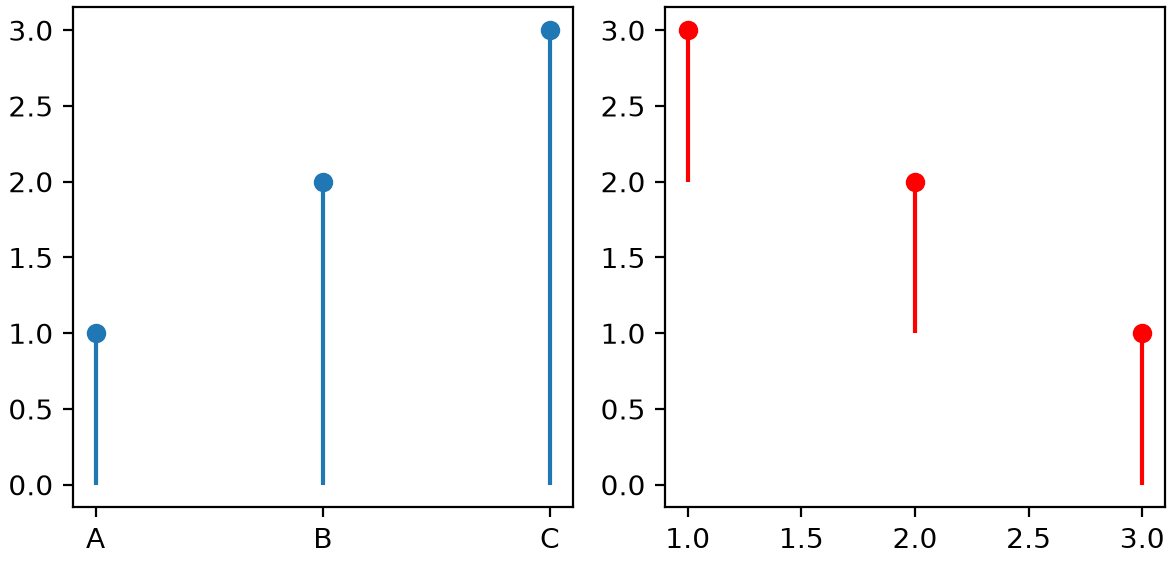
mplu.lollipop(["A", "B", "C"], [1, 2, 3], ax=ax0)
mplu.lollipop([1, 2, 3], [3, 2, 1], ax=ax1, color="r", base=(2, 1, 0))

for ax in (ax0, ax1):
    mplu.set_axes_size(2.5, ax=ax)
(
Source code,png,hires.png,pdf)