mplutils.add_abc#
- mplutils.add_abc(fig=None, xoffset_pts=2.0, yoffset_pts=-12.0, anchor='top left', labels='a;b;c;d;e;f;g;h;i;j;k;l;m;n;o;p;q;r;s;t;u;v;w;x;y;z', labels_sep=';', pre='(', post=')', start_at=0, rowsfirst=True, **text_kwargs)[source]#
Add labels to all suplots in fig.
By default, adds ‘(a)’, ‘(b)’, … to each subplot in the upper-right corner.
- Parameters:
- fig
matplotlib.figure.Figure, optional If None, use last active figure.
- xoffset_pts
float, default:2.0 Offset in pts from anchor. Positive moves right.
- yoffset_pts
float, default:-12.0 Offset in pts from anchor. Positive moves up.
- anchor{
"top left","top right","bottom left","bottom right"} Specify anchor point of the labels (offsets are relative to this). Refers to the corner of the graph-area of the axes.
- labels
str, optional, default"a;b;c;d; ... ;y;z", A string of labels, where each label is seperated by labels_sep.
If
None, use label of the respective axes (i.e.,ax.get_label()).- labels_sep
str, default";" Separator used for labels.
- pre
str, default:"(" String in front of labels.
- post
str, default:")" String after labels.
- start_at
int, default: 0 Skip start_at entries in labels. Only applies if labels is not
None.- rowsfirstbool, default:
True Label rows first, e.g., “a b c / d e f” instead of “a c e / b d f”. Only applies if labels is not
None.- text_kwargs
Additional keyword arguments of
matplotlib.text.Text. For a list thereof, see here.
- fig
- Returns:
- text_dict
dict[matplotlib.axes.Axes,matplotlib.text.Text] A dictionary with the axes of fig as keys and the corresponding text instances added by
add_abcas values.Can be used to manipulate the text later (to, e.g., change the color of the text only for certain subplots).
- text_dict
Notes
Cannot handle a fancy
matplotlib.gridspec.GridSpec, e.g., where one subplot spans multiple other subplots. If you need one of those, you’re on your own.Examples
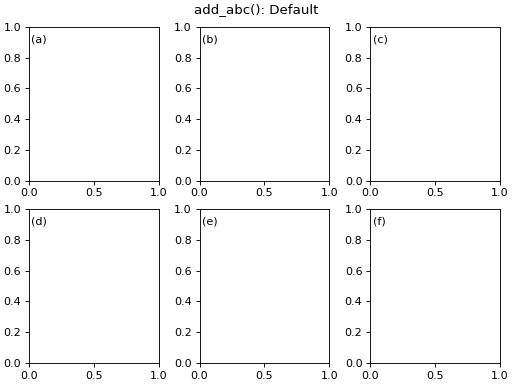
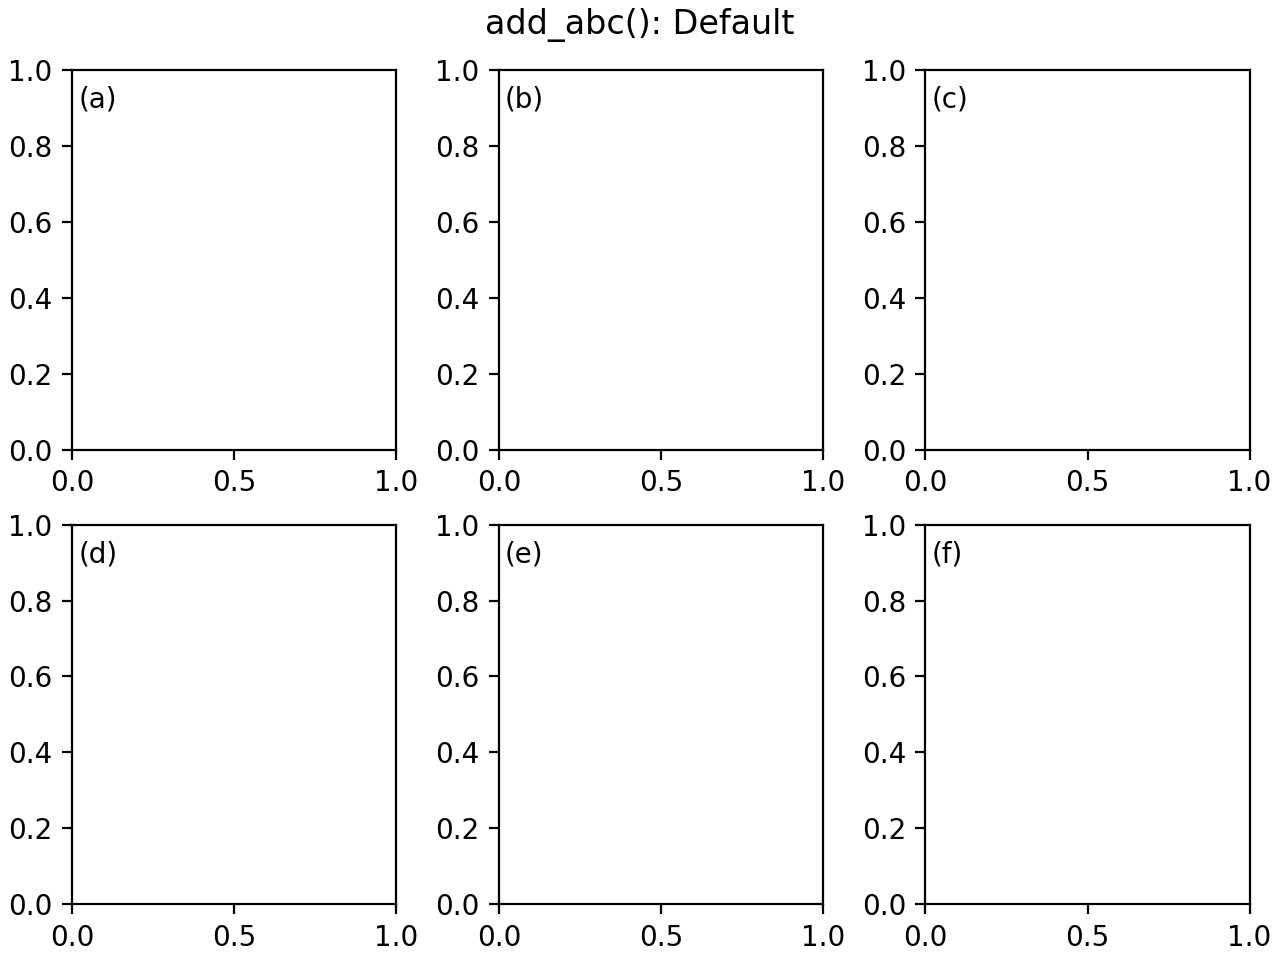
import matplotlib.pyplot as plt

import mplutils as mplu

fig, _ = plt.subplots(2, 3, layout="compressed")
mplu.add_abc()
fig.suptitle("add_abc(): Default")
plt.show()
(
Source code,png,hires.png,pdf)
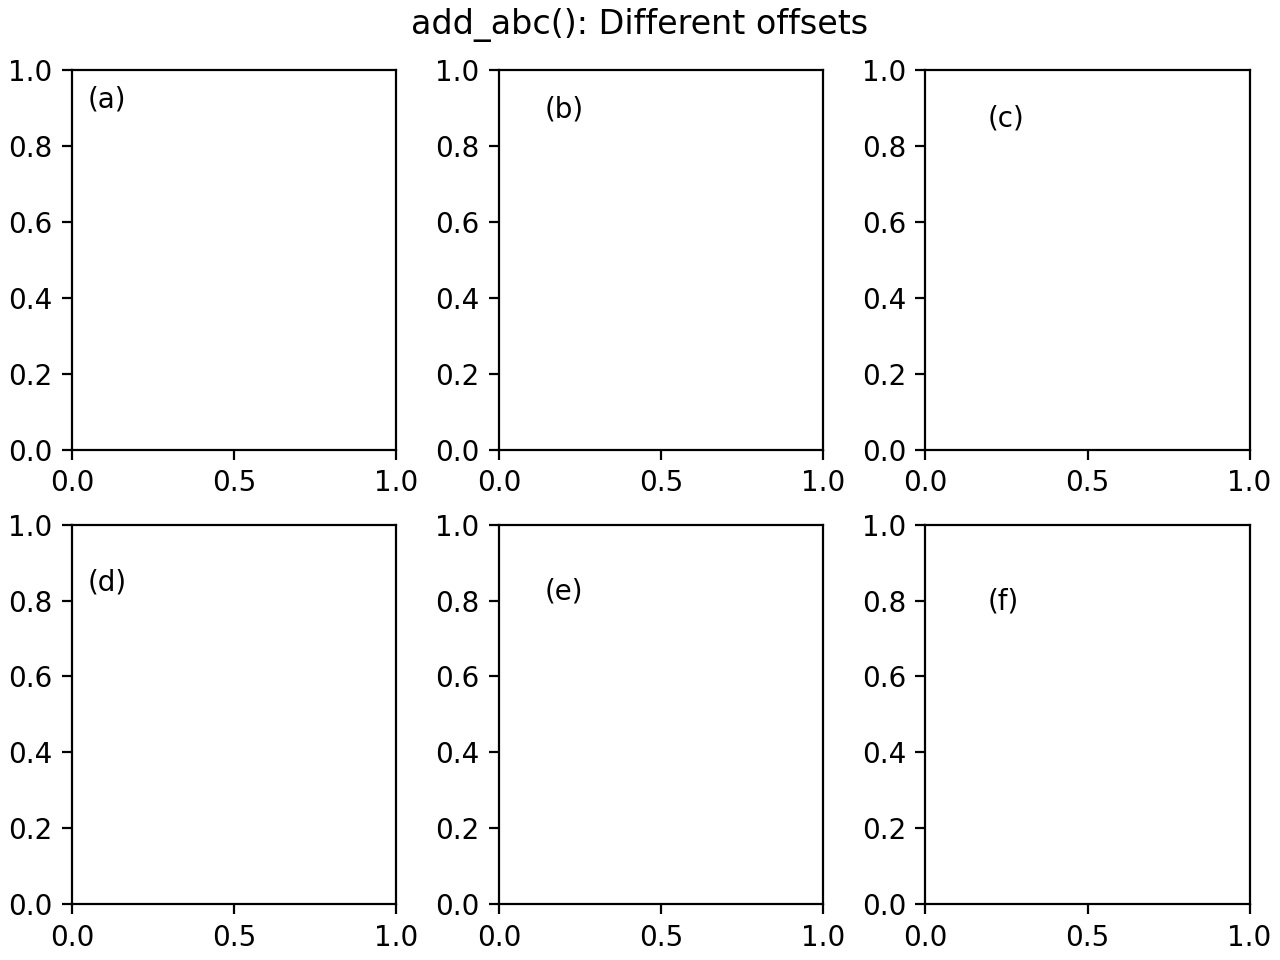
import matplotlib.pyplot as plt

import mplutils as mplu

fig, axs = plt.subplots(2, 3, layout="compressed")
fig.suptitle("add_abc(): Different offsets")
mplu.add_abc(xoffset_pts=(5, 15, 20), yoffset_pts=((-12, -15, -18), (-21, -24, -27)))

plt.show()
(
Source code,png,hires.png,pdf)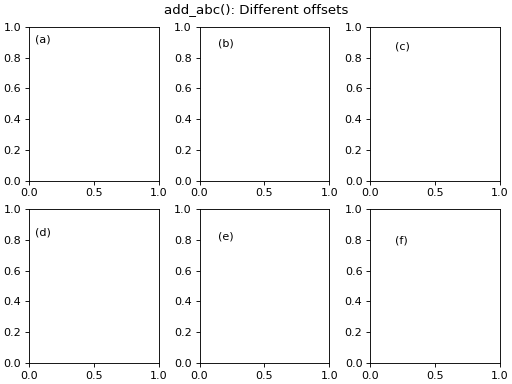
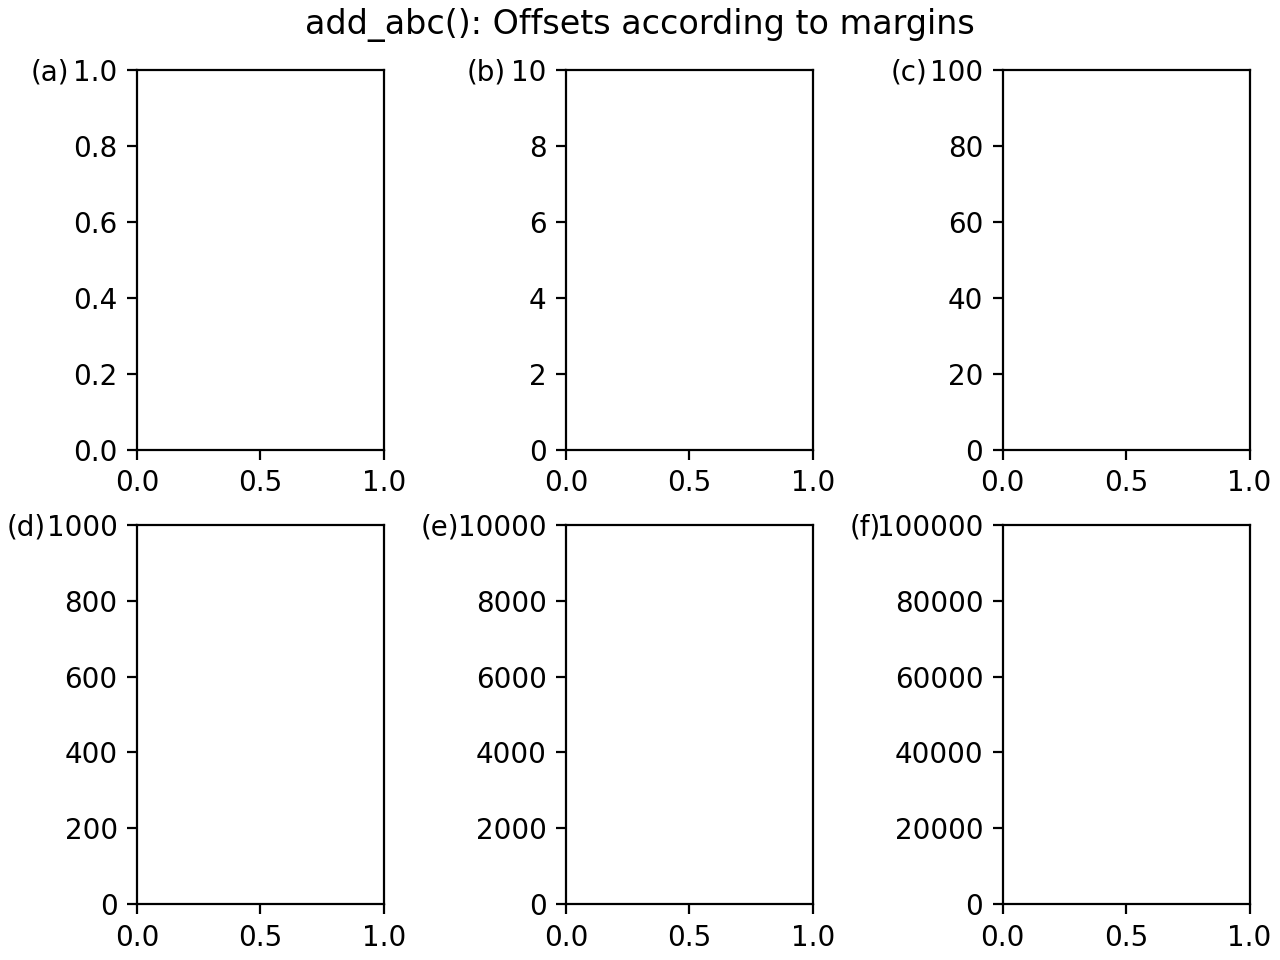
import matplotlib.pyplot as plt
import numpy as np

import mplutils as mplu

fig, axs = plt.subplots(2, 3, layout="compressed")

fig.suptitle("add_abc(): Offsets according to margins")

xoffsets = np.empty_like(axs, dtype=float)
yoffsets = np.empty_like(axs, dtype=float)
lim = 1.0

for (i, j), ax in np.ndenumerate(axs):
    ax.set_ylim(0, lim)
    lim *= 10
    margins = mplu.get_axes_margins(ax)
    xoffsets[i, j] = -margins[3] - 5.0
    yoffsets[i, j] = margins[0]

mplu.add_abc(xoffset_pts=xoffsets, yoffset_pts=yoffsets, ha="right", va="top")
(
Source code,png,hires.png,pdf)