mplutils.add_colorbar#
- mplutils.add_colorbar(mappable, ax=None, location='right', thickness='5%', pad='3.5%', unit='pts', label=None, **text_kwargs)[source]#
Add a colorbar to ax.
It uses
matplotlib.figure.Figure.colorbar()to create a colorbar and adjusts tick positions and labels appropriately depending on location.Warning
This method is intended to be used with
FixedLayoutEngine. Matplotlib’s own layouts (e.g., constrained layout) may not work as intended.Warning
If you use this method with
imshow(), set the use the keywordaspect="auto", otherwise the colorbar may not be aligned properly.- Parameters:
- mappable
matplotlib.cm.ScalarMappable The colormap described by this colorbar.
For more information, see
matplotlib.pyplot.colorbar().- ax
matplotlib.axes.Axes, optional The axes to which the colorbar is added.
If
None, use currently active axes.- location{“left”, “right”, “top”, “bottom”}, default:
"right" Location of the colorbar relative to ax.
- thickness
floatorstrorNone, default “5%” The thickness of the colorbar in pts.
If
None, use the default values ofmatplotlib.figure.Figure.colorbar().If str, must be of form “x%” and will set the thickness relative to the axes size.
Warning
If thickness is of form “x%”, it is relative to the initial size of the axes. If you resize the axes afterward (e.g., with
set_axes_size()), the thickness will not be updated.- pad
floatorstrorNone, default “3.5%” The pad between the colorbar and axes in pts.
Analog to thickness.
- label
str, optional Label of the colorbar.
By default, the label of a right-sided colorbar will read from top to bottom.
- unit{“mm”, “pts”, “inch”}, default “pts”
Unit of thickness and pad.
- mappable
- Returns:
- colorbar
matplotlib.colorbar.Colorbar
- colorbar
- Other Parameters:
- **text_kwargs
Additional keyword arguments passed to
matplotlib.colorbar.Colorbar.set_label().
Examples
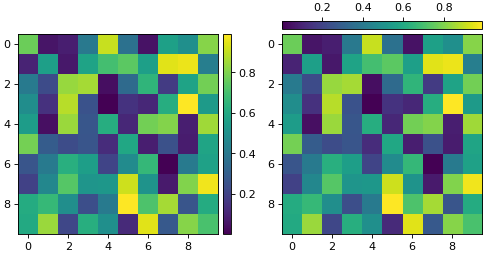
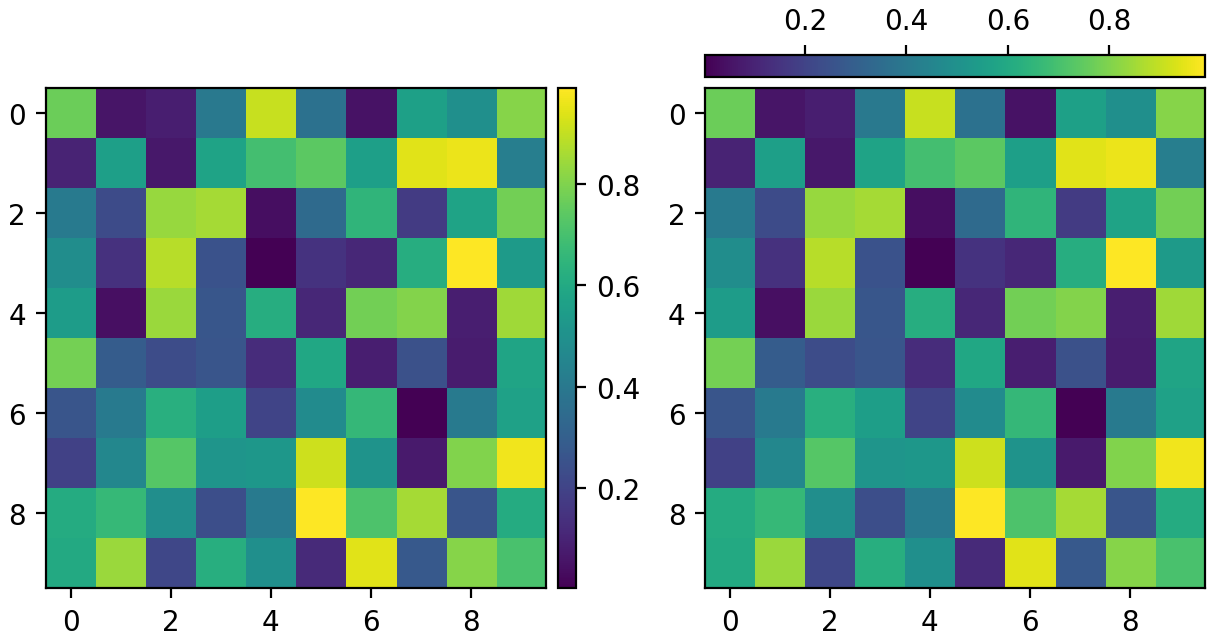
import matplotlib.pyplot as plt
import numpy as np

import mplutils as mplu

plt.rcParams["image.aspect"] = "auto"

fig, axs = plt.subplots(1, 2, layout=mplu.FixedLayoutEngine())

image = np.random.rand(10, 10)

im0 = axs[0].imshow(image)
im1 = axs[1].imshow(image)

mplu.add_colorbar(im0, ax=axs[0])
mplu.add_colorbar(im1, ax=axs[1], thickness=8.0, pad=4.0, location="top")

for ax in axs:
    mplu.set_axes_size(2.5, ax=ax)

# the colorbar placement shifts the axes position, we need to realign it
mplu.align_axes_vertically(*axs, alignment="bottom")
(
Source code,png,hires.png,pdf)