mplutils.crop_colormap#
- mplutils.crop_colormap(cmap, x=0.0, y=1.0, new_cmap_name=None, register=False, n_lut=256)[source]#
Return a colormap within (x,y) range
- Parameters:
- cmap
A matplotlib colormap, as returned by
matplotlib.colormaps["colormap_name"].- x
float, default = 0.0 Lower limit of the colorbar (in relative units).
- y
float, default = 1.0 Upper limit of the colorbar (in relative units).
- new_cmap_name
str, optional Optionally, give the colormap a name.
If
None, colormap will be called"_new_colormap".- registerbool, default
False Register the colormap.
If it is registered, one can call it simply by it’s name (i.e.,
new_cmap_name).- n_lut
int, default 256 The number of segments of the old colormap.
- Returns:
- new_cmap
matplotlib.colors.LinearSegmentedColormap. The new colormap.
- new_cmap
Examples
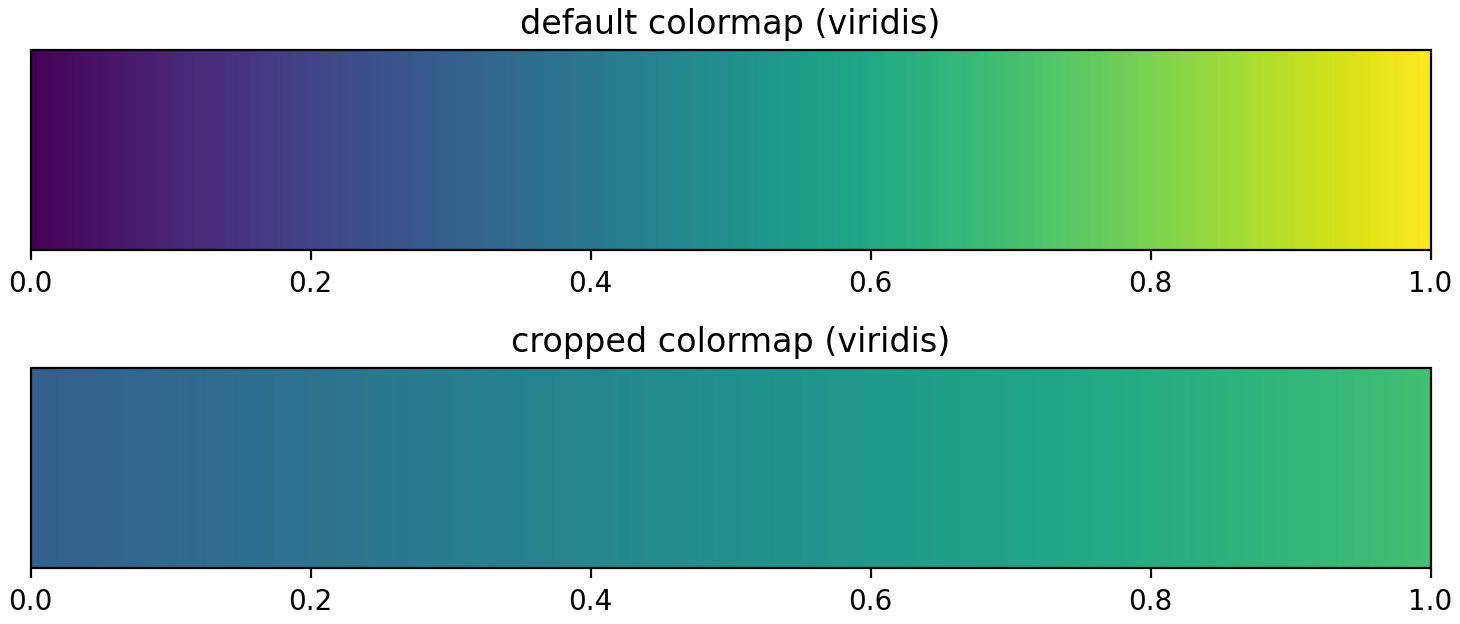
import matplotlib.pyplot as plt

import mplutils as mplu

viridis = plt.get_cmap("viridis")
viridis_cropped = mplu.crop_colormap(viridis, 0.3, 0.7)
cmaps = viridis, viridis_cropped

fig, axs = plt.subplots(2, 1, layout=mplu.FixedLayoutEngine())

titles = "default colormap (viridis)", "cropped colormap (viridis)"
for ax, title, cmap in zip(axs, titles, cmaps):
    fig.colorbar(plt.cm.ScalarMappable(cmap=cmap), cax=ax, orientation="horizontal")
    ax.set_title(title)
    mplu.set_axes_size(7, 1.0, ax=ax)

plt.show()
(
Source code,png,hires.png,pdf)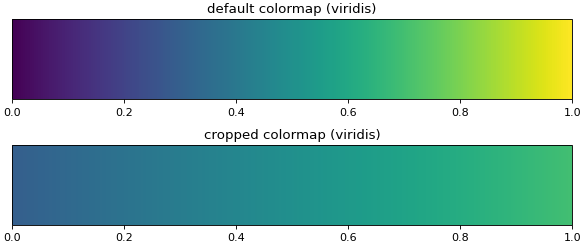