mplutils.dotted#
- mplutils.dotted(linewidth=None, fontsize=None, legend_handlelength=None, **aliases)[source]#
Return a tuple to create a dotted line that fits perfectly into a legend.
For that to work properly you may need to provide the linewidth of the graph and the fontsize of the legend.
- Parameters:
- linewidth (or lw)
float, optional, default:rcParams["lines.linewidth"] - fontsize
floatorstr, Optional, default:rcParams["legend.fontsize"] The fontsize used in the legend
float: fontsize in pts
str:
"xx-small","x-small","small","medium","large","x-large","xx-large","larger", or"smaller"
- legend_handlelength (or lh)
float, defaultrcParams["legend.handlelength"] Length of the legend handles (the dotted line, in this case) in font units
- linewidth (or lw)
- Returns:
See also
dash_dotted()Create dotted-line linestyle.
dashed()Create dash-dotted-line linestyle.
Examples
import matplotlib.pyplot as plt
import mplutils as mplu

plt.plot([0., 1.], linestyle=mplu.dotted())
plt.legend()

# if one changes the linewidth, the fontsize of the legend, or the
# handlelength of the legend from the default, this needs to be passed
# to dotted().
plt.plot([0., 1.],
         linewidth=2.,
         linestyle=(mplu.dotted(linewidth=2.,
                              legend_handlelength=3.,
                              fontsize="x-small")))
plt.legend(fontsize="x-small", handlelength=3.)

# alternatively, use rcParams to set these values
plt.rcParams["lines.linewidth"] = 2.
plt.rcParams["legend.handlelength"] = 3.
plt.rcParams["legend.fontsize"] = "x-small"
plt.plot([0., 1.], linestyle=mplu.dotted())
plt.legend()
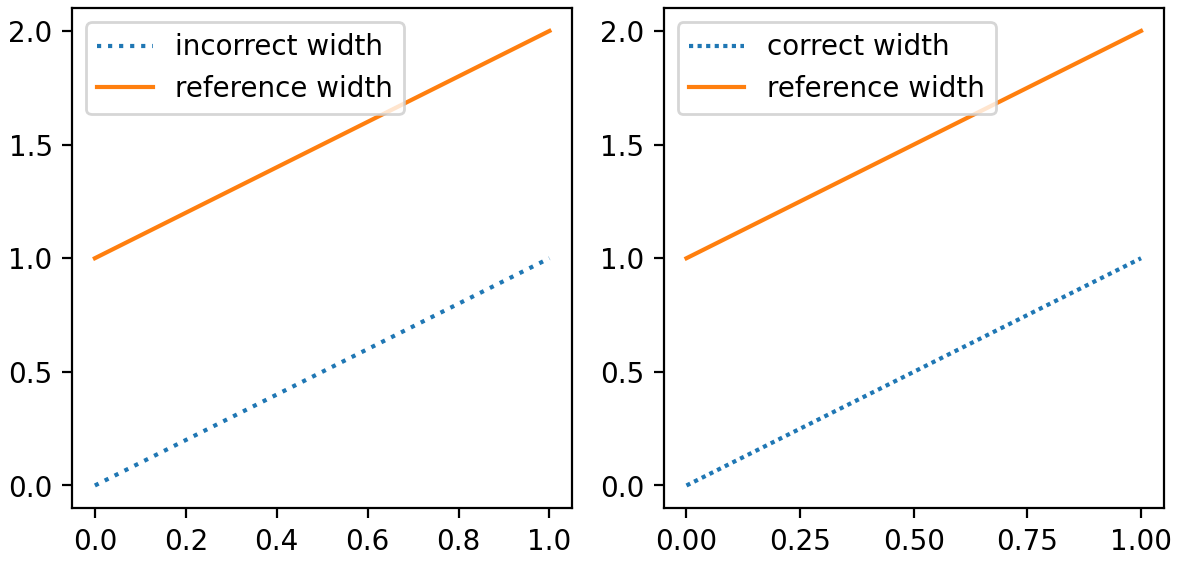
import matplotlib.pyplot as plt

import mplutils as mplu

_, (ax0, ax1) = plt.subplots(1, 2, layout=mplu.FixedLayoutEngine())

ax0.plot([0, 1], ls=":", label="incorrect width")
ax0.plot([1, 2], ls="-", label="reference width")
ax1.plot([0, 1], ls=mplu.dotted(), label="correct width")
ax1.plot([1, 2], ls="-", label="reference width")

for ax in (ax0, ax1):
    mplu.set_axes_size(2.5, ax=ax)
    ax.legend()
(
Source code,png,hires.png,pdf)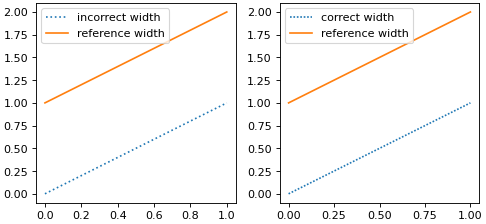