mplutils.FixedLayoutEngine#
- class mplutils.FixedLayoutEngine(margin_pads_pts=3.0, margin_pads_ignore_labels=False, col_pads_pts=10.0, col_pads_ignore_labels=False, row_pads_pts=10.0, row_pads_ignore_labels=False, max_figwidth=inf)[source]#
Custom matplotlib
LayoutEngine.This layout engine adjust the size of the figure while fixing the size of the axes.
Attention
The layout engine must be attached to a figure before any colorbars are added to it.
Constrains:
Fancy gridspecs are not supported. For example, an axes cannot span multiple cells in the grid.
The layout needs to be set before any colorbars are added.
Suptitlesof figures are currently not seen by the engine.Colorbars should be added by
matplotlib.figure.Figure.colorbar()oradd_colorbar().This layout is not intended for interactive backends (such as used by
matplotlib.pyplot.show()). Using this with an interactive backend will eventually break the layout.
Note
Use
set_axes_size(),set_colorbar_thickness(), andset_colorbar_pad()to control the physical size of axes and colorbars.Warning
Calling
matplotlib.pyplot.tight_layout()will disable this layout engine.- Parameters:
- margin_pads_pts
floator (float, …), default 3.0 Add padding around the subplot area.
If axes labels are taken into account when calculating the necessary margins is controlled by margin_pads_ignore_labels.
Depending on the number of values passed, control:
- 1 value:
(top, right, bottom, left)
- 2 values:
(top, bottom), (right, left)
- 3 values:
top, (right, left), bottom
- 4 values:
top, right, bottom, left
- margin_pads_ignore_labelsbool or
tuple(bool, …), defaultFalse Control if margin_pad_pts should ignore axes decorations, such as labels or colorbars.
The number of bools passed is analogous to margin_pad_pts.
- col_pads_pts
floatortuple(floats, …), default 10.0 Padding between each column of the subplots.
If axes labels are taken into account when calculating the necessary space is controlled by col_pads_ignore_labels.
Multiple values will correspond to each column.
- col_pads_ignore_labelsbool or
tuple(bools, …), defaultFalse Control if col_pad_pts should ignore axes decorations, such as labels or colorbars.
The number of bools passed is analogous to col_pads_pts.
- row_pads_pts
floatortuple(floats, …), default 10.0 Padding between each row of the subplots.
If axes labels are taken into account when calculating the necessary space is controlled by row_pads_ignore_labels.
Multiple values will correspond to each row.
- row_pads_ignore_labelsbool or
tuple(bools, …), defaultFalse Control if row_pad_pts should ignore axes decorations, such as labels or colorbars.
The number of bools passed is analogous to row_pads_pts.
- max_figwidth
float, defaultnumpy.inf Maximum allowed figure width in inches after layout is applied.
If the current parameters result in a figure with a width larger than this,
InvalidFigureErrorwill be raised.
- margin_pads_pts
- Raises:
InvalidFigureErrorRaised if figure width exceeds max_figwidth.
Examples
For a figure to use this layout, its layout engine needs to be configured. Some ways to do this are
fig, ax = plt.subplots_mosaic([["a"]], layout=mplu.FixedLayoutEngine())
fig, ax = plt.subplots(layout=mplu.FixedLayoutEngine())
ax = plt.subplot()
plt.gcf().set_layout_engine(mplu.FixedLayoutEngine())
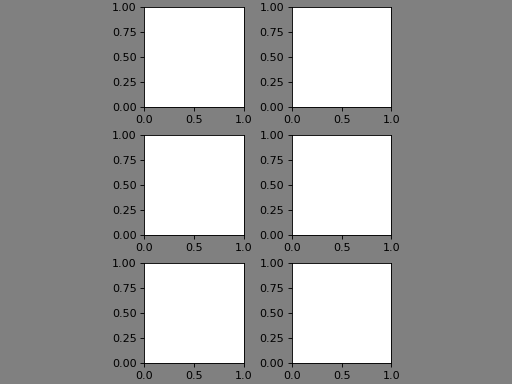
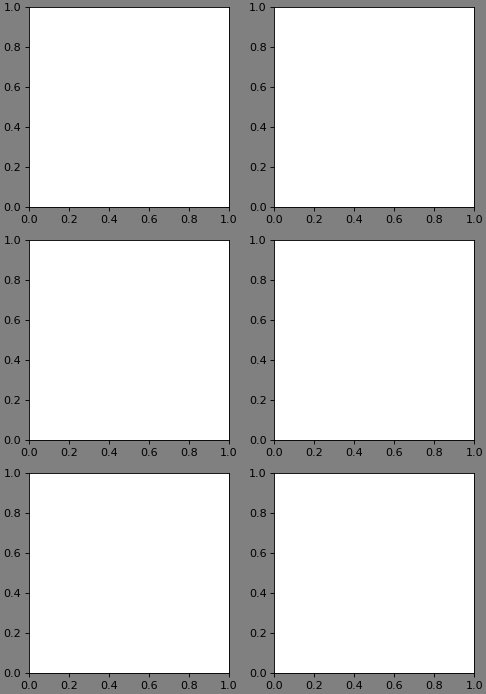
The two examples below showcase the difference between this layout engine and, e.g., the compressed layout of matplotlib.
With the “compressed” layout of matplotilb, since the figure height is fixed, the axes in the subplots are shrunk dramatically, and lots of space within the figure is “wasted”. To fix this, one has to manually adjust the figure height.
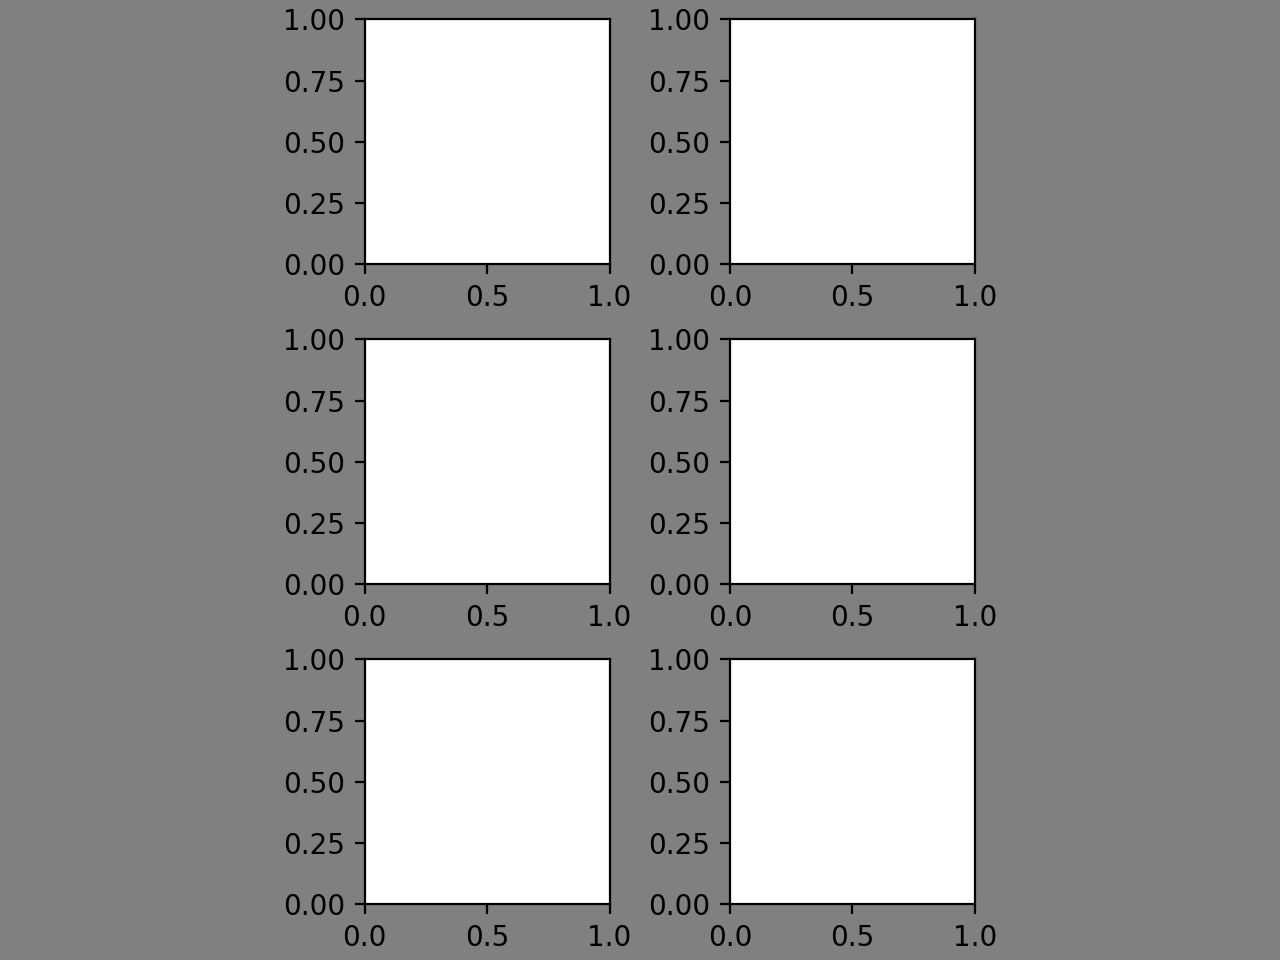
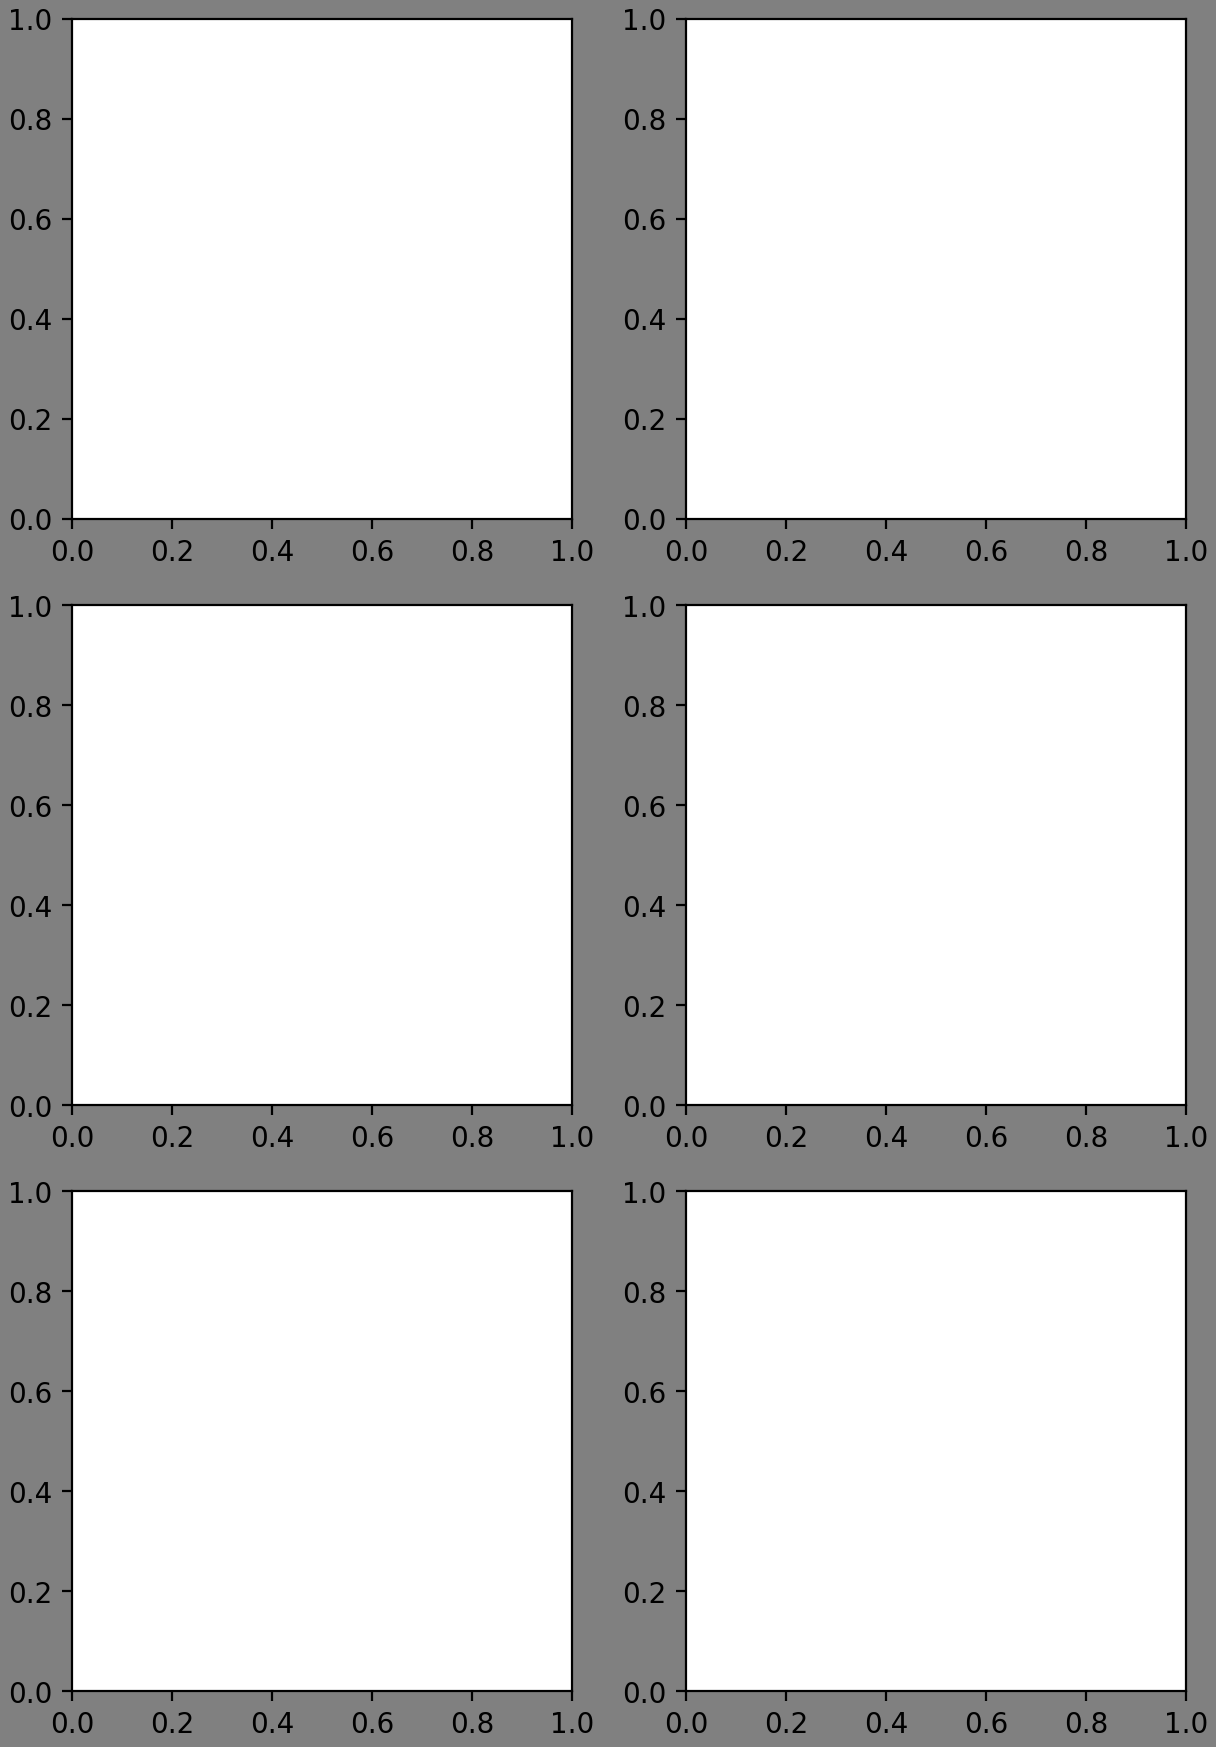
With the FixedAxesLayoutEngine, the size of the axes is fixed. This way, we can set our desired size using
set_axes_size()and all necessary parameters will be calculated by the engine (such as figure width and height, margins, padding between rows and columns).import matplotlib.pyplot as plt fig, axs = plt.subplots(3, 2, layout="compressed") fig.set_facecolor("grey") for ax in axs.flat: ax.set_box_aspect(1)
(
Source code,png,hires.png,pdf)
import matplotlib.pyplot as plt

import mplutils as mplu

fig, axs = plt.subplots(3, 2, layout=mplu.FixedLayoutEngine())
fig.set_facecolor("grey")

for ax in axs.flat:
    mplu.set_axes_size(2.5, ax=ax)
(
Source code,png,hires.png,pdf)
Methods